
June 2024 - #EUSustainableFinance
The EU Taxonomy, a classification system, is an important market transparency tool that helps direct investments to activities most needed for the transition to net zero and environmental sustainability.
Under new EU rules, large, listed EU companies started in 2023 to report against the Taxonomy’s two climate objectives – climate change mitigation and climate change adaptation. First reports from this year are also becoming available, which now also include information on the Taxonomy’s other four environmental objectives[1].
The initial evidence is encouraging: companies, public entities, and financial actors are increasingly using the Taxonomy for their business strategies, transition planning, investing and lending.
Companies

Companies have started using the Taxonomy to plan and highlight their green investments. On average, around 20% of companies’ capital investments are aligned with the Taxonomy. The highest investments are made in the utilities sector, in particular by electricity providers (over 60% Taxonomy-aligned).[2]
Capital investments into Taxonomy-aligned activities have increased in 2024 compared to the previous year. In 2023, around 600 European companies reported capital investments into Taxonomy-aligned activities of €191bn. Thus far in 2024, companies have already reported €249bn, signalling significant growth.[3] This adds up to a total of €440bn in 2023 and 2024 so far (as of 6 May 2024).These numbers are expected to grow further as companies start to report on the four environmental objectives of the Taxonomy, increasing the scope of eligible companies.

Companies are increasingly using the Taxonomy to guide and showcase their taxonomy-aligned capital investments in key sectors to meet the Green Deal targets (see table below).
Taxonomy-aligned investments | ||||
|---|---|---|---|---|
| Number of companies reporting | Total aligned investments (€bn) | |||
| 2022 | 2023 | 2022 | 2023 | |
| Utilities | 62 | 67 | 109 | 132 |
| Consumer discretionary | 66 | 86 | 35 | 45 |
| Industrials | 207 | 243 | 22 | 27 |
| Energy | 26 | 32 | 11 | 23 |
| Real estate | 35 | 41 | 4 | 5 |
| Other sectors | 212 | 254 | 11 | 16 |
| TOTAL | 608 | 723 | 191 | 249 |
Note: Data from 6 May 2024; figures in the table have been rounded, hence totals may not always correspond exactly to the numbers shown.
For the financial years 2022 and 2023 (as of 26 May 2024), companies located in Germany reported the highest taxonomy-aligned investments (€114bn), followed by France (€63bn), Spain (€60bn), and Italy (€48bn).
Stock market data indicates that alignment to the Taxonomy correlates with positive market performance as companies disclosing high Taxonomy figures have outperformed the overall market in recent years (see graph below).
EU Taxonomy Leader and Transition companies have outperformed the STOXX 600 and MSCI ACWI since 2019
Equal-weighted weekly indexed TSR from 1 January 2019 to 13 May 2024
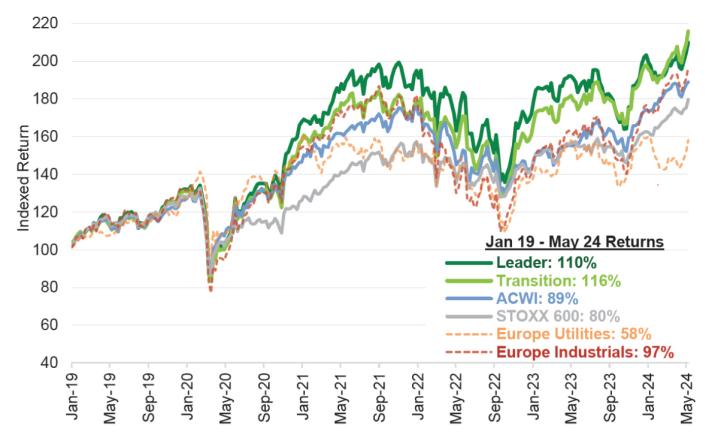
Source: FactSet, LSEG, Goldman Sachs Global investments Reserach
Public sector

In 2023, 90% of green bonds issued by EU public actors referenced the EU Taxonomy to illustrate their commitment of using the raised funds for green projects.
Banks & financial markets

Banks are starting to use the Taxonomy in their lending strategies and in their assessment of companies’ investment plans. Mortgages and other loans to activities in the scope of the Taxonomy represent, on average, over 50% of the assets of large EU banks based on first-year figures.
The EU is a leading issuer of green bonds worldwide. More than half of the 2023 global green bond volume originated from Europe.[4]
Investors

56% of EU funds either promote environmental or social characteristics or have a sustainable investment objective as disclosed according to the Sustainable Finance Disclosure Regulation (SFDR)[5].The assets aligned with the Taxonomy form a small, but growing part of what these funds invest in.

Going beyond the Taxonomy, latest figures show that €180bn of assets under management meet the criteria of the EU climate transition benchmarks and EU Paris aligned benchmarks (The EU climate benchmarks)[6], expected to surpass the €200bn mark in due course. These climate benchmarks have been recognised by major investment institutions as solid tools to help investors’ decarbonisation pathway strategies.

To improve the usability of the Taxonomy and its market uptake, the Commission is working on implementation guidance that is regularly updated and made available through the Taxonomy Navigator. It addresses both large companies who have to report on Taxonomy alignment as well as small ones who don’t, and regardless of their starting points in the green transition.
Notes
1. The four environmental objectives of the EU Taxonomy are: i) sustainable use and protection of water and marine resources, ii) transition to a circular economy, iii) pollution prevention and control, and iv) protection and restoration of biodiversity and ecosystems.
2. These figures are based on the reporting by companies in the scope of the Non-financial Reporting Directive.
3. The latest data are based on companies’ reporting for financial year 2023 and, for companies that haven’t yet reported, financial year 2022. The investment amount includes the EU as well as Norway, Switzerland and the UK.
4. Source: Global State of the Market Report 2023, Climate Bonds Initiative; the figure covers sovereign and private issuance, and includes the UK as well as EFTA.
5. In accordance with Articles 8 and 9 of the EU Sustainable Finance Disclosure Regulation.
6. The EU climate benchmarks are investment benchmarks that integrate specific criteria related to e.g. reducing greenhouse gas emissions and supporting the transition to a low-carbon economy.
Sources: Bloomberg, Platform on Sustainable Finance, Goldman Sachs Global Investment Research, LSEG, FactSet, Climate Bonds Initiative.